1  M: Research Questions and Claims

Topics

  • Science and everyday thinking
    • Truth: Dichotomous (true or false)
    • Justification: A matter of degree
    • Resist dichotomous thinking, embrace uncertainty
  • Research question
    • Give context (research area)
    • Motivate why important (research gap)
    • Formulate precisely (exposure and outcome variables(s), study population)
    • Chose research design
  • Error
    • Random error
    • Systematic error = bias
  • Validity of research claims
    • Campbell’s validity typology:
      • Statistical conclusion validity
      • Internal validity
      • Construct validity
      • External validity
    • Threats to validity
    • Design elements to counteract threats to validity

Theoretical articles to read:

  • Steiner et al. (2023) on frameworks for causal inference, the sections on Campbell’s validity typology/threats framework

  • Gelman et al. (2021) mentions internal and external validity as several places, see for example chapter 18, pp. 354-355, where they use the term “threats to validity” and discusses issues related to validity, such as the “Hawthorne effect” and experimenter effects.


1.1 Science and everyday thinking

Science is nothing more than a refinement of everyday thinking.
Albert Einstein (cited in Haack, 2011)


Science is nothing more than a refinement of everyday thinking. It’s the application of common sense, understood as “good sense” or “sound reason” or “logical thinking”. There is only one logic, and it applies to all rational activities, be it research, criminal investigations, medical diagnosis, or political decisions.

Unfortunately, our intuitions often lead us wrong, and what may appear a sensible conclusion may turn out otherwise. The “refinement of everyday thinking” is the wisdom that researcher has gained from thinking about problems. Thinking a bit harder and in terms of alternative explanations may help. Let’s practice on this statement:

Industrial workers are healthier than the general population. Thus, work in industry is good for your health.

Please find alternative explanations.

Justification

Research aims at increasing our knowledge, typically factual knowledge about the world. Philosophers may debate how to best define “knowledge”, but most would agree that truth and justification are the two key elements. To know something requires that it is true. You may believe that the earth is flat as a pancake, but you cannot know it because your belief is false. But truth is not enough. I may claim that there are living organisms on the planet Jupiter. If such organisms indeed are discovered a hundred years from now, I was right, but still I didn’t know, because my claim was unjustified, I lacked good reasons. Maybe in a dream I saw small germs crawling the surface of Jupiter. Dreams are not good reasons for believing things and therefor may claim would be dismissed as unjustified.

What is more important, being true or being justified? For a researcher, the answer is straight forward, research is all about justification. A scientific claim is only taken seriously if justified. It happens that justified claims turn out to be false, because the agreement between truth and the presence of good reasons is not perfect. But, luckily, it is typically much easier to find good reasons for true than for false claims. As every defense attorney knows, it is typically easier to defend an innocent client than one guilty as charged. Simply because the prosecutor will have a harder time finding good reasons for guilt of innocent suspects.

The primacy of justification over truth is old news:

Herodotus, in about 500 BC, discusses the policy decisions of the Persian kings. He notes that a decision was wise, even though it led to disastrous consequences, if the evidence at hand indicated it as the best one to make; and that a decision was foolish, even though it led to the happiest possible consequences, if it was unreasonable to expect those consequences.

Cited in Jaynes (1985)


Justification is a matter of degree, so research claims are more or less justified. That is why researchers typically speak of their results as providing some degree of support of their hypothesis, not as conclusive evidence for or against. Here examples of phrases, from weak to strong support:

  • Our results are consistent with the notion that …
  • Our results may suggest that …
  • Our results weakly support our hypothesis that …
  • Our results provide clear evidence for our hypothesis that …
  • Our results strongly supports our hypothesis that …
  • Our results, together with previous research, leave little doubt that …

There will always be room for uncertainty in empirical research, and that is why researchers think and talk about there results as more or less in support of their hypothesis.

1.2 Research question

As essential as it is to justify our research claims, it is equally critical to ask the right question. The questions we pose drive the research design, guiding the collection and analysis of data from which we draw and justify our conclusions. However, formulating the right question is no small task; it demands both creativity and insight. This process involves identifying gaps in existing knowledge and intuitively exploring new, promising directions. If successful, these new paths can significantly advance our research field; if not, they may lead to another dead end, a common outcome in research.

Once a general research idea is in place, considerable effort must be invested in precisely articulating the research question. In research papers, this question is typically presented in the Introduction, following a structured approach:

  1. The opening paragraph(s) establish the broader context for the research problem.

  2. A literature review identifies the specific knowledge gap that necessitates the question.

  3. The research question is then concisely and precisely formulated, usually specifying the independent variable(s), dependent variable, and unit of analysis.

  4. A brief overview of the research design chosen to address the question is provided at the end of the Introduction.

Note that the research question can also be introduced as a hypothesis. In such cases, the goal of the research is to evaluate this hypothesis.

Below is a practice question (1E1) that involves analyzing how the research problem was described and justified in the Introduction of a recent paper.

1.3 Random and Systematic error

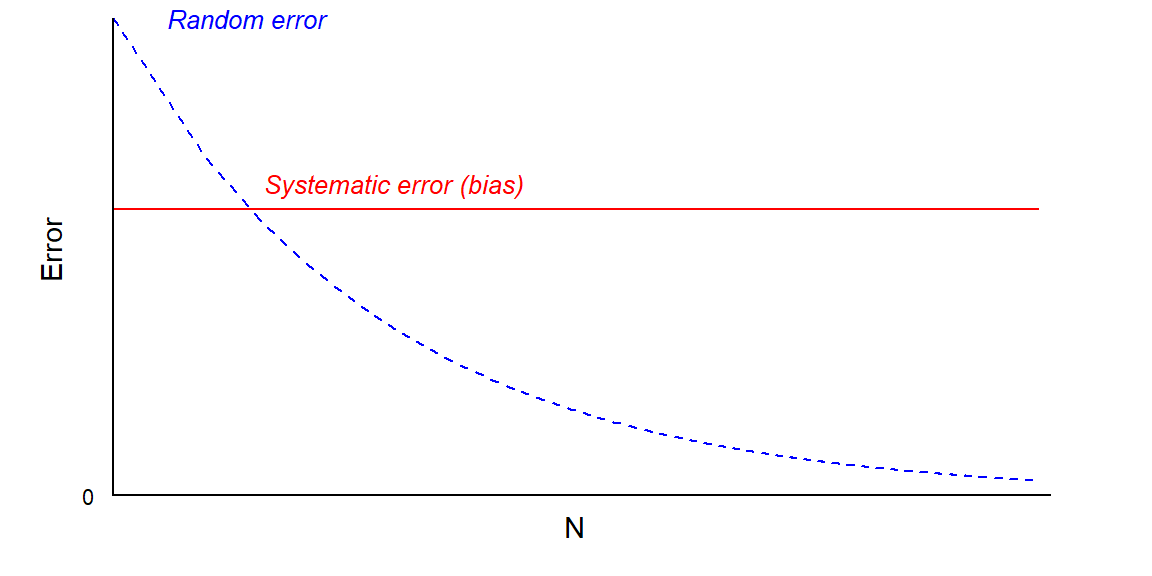
Two types of error:

  • Random error. The sum of many unknown and independent errors decrease with study size (the number of observations) or reliability of measurements. We will talk about three types of random error:
    • Random measurement error. Measurements may underestimate or overestimate true scores, despite high test validity.
    • Sampling error. Random sampling of participants from a target population may still lead to unrepresentative samples.
    • Randomization error. Random assignment of participants to treatment to groups may still lead to unbalanced groups.
  • Systematic error, also known as bias. Stays constant no matter the study size or reliability of tests. Examples of bias:
    • Confounding bias
    • Selection bias
    • Measurement bias (related to validity of test scores)
Code
# Plot settings
par(mar = c(2, 2, 0, 2), 
    mgp = c(0.2, 0.5, 0)) # First argument mgp, distance label to axis

# Data to plot
x <- 1:1000
y_random <- 1/sqrt(x)
y_systematic <- rep(0.6, length(x))

# Plot
plot(log(x), y_random, pch = '', axes = FALSE, 
     xlab = "N", ylab = "Error", cex.lab = 0.9)
lines(log(x), y_random, lty = 2, col = "blue")
lines(log(x), y_systematic, col = "red")
axis(1, at = c(0, 7), labels = c("", ""), pos = 0, tck = 0)
axis(2, at = c(0, 1), labels = c("0", ""), pos = 0, tck = 0, las = 2,
     cex.axis = 0.7)

# Add text to figure
text(x = 1, y = 1, "Random error", cex = 0.8, col = "blue", font = 3)
text(x = 2.1, y = 0.65, "Systematic error (bias)", cex = 0.8, 
     col = "red", font = 3)
Figure 1.1: Error and study size. Redrawn from Fig. 7.1 in Rothman (2012).


N may refer to several things:

  • The number of tested individuals (sample size) over which scores are averaged.
  • Number of items used to create a sum score per individual.
  • Number of stimulus repetitions per individual. The participants response to a given stimulus is calculated as the average response to a specific stimulus.

Thus, the figure applies equally well to errors of group averages as to measurement at the individual level (reliability and validity of test scores.) Averaging over repeated measures (e.g., many items in a questionnaire or many repetitions of the same stimulus in a psychophysical experiment) reduces random error but not systematic error (see also Chapter 5).

1.4 Validity: Types, Threats, and Tricks

Campbell and co-workers developed a qualitative approach to causal inference that has been very influential in psychology and related fields. It is a description of how researchers thinks (or should think) when designing a study or when evaluating evidence from a published study. It encourage us to think in terms of alternative explanations (threats to validity) and to counteract these threats with clever design elements (or design “tricks”).

Three steps

  1. Specify validity type.
  2. Identify threats to validity.
  3. Apply design elements (tricks) to counteract threats to validity. i.e., to rule out plausible alternative explanations.


Here is how Steiner et al. (2023) define the validity types:

  • Internal validity. The validity of inferences about whether the observed association between treatment status T and outcome Y reflects a causal impact of T on Y. Thus, internal validity is about the assumptions required for causal inference.
  • Statistical conclusion validity. The validity of inferences about the association (covariation) between the presumed treatment T and outcome Y. Thus, this validity type is about the assumptions required for making statistical inference from the realized randomization or sampling outcomes to the underlying target populations of possible treatment assignments and participants.
  • Construct validity. The validity with which inferences are made from the operations and settings in a study to the theoretical constructs those operations and settings are intended to represent. It is about the correct labeling of variables and accurate language use.
  • External validity. The validity of inferences about whether the observed cause-effect relationship holds over variations in participants, settings, treatments, outcomes, and times. External validity directly relates to the assumptions required for generalizing effects

Campbell’s typology was developed in a time when psychology research methods and statistics largely focused on whether associations were significant or non-significant. This kind of dichotomous thinking has many problems (see for example, Amrhein et al., 2019).

This table is my attempt to apply the typology to research aiming at estimating effect sizes, rather than categorizing results as significant versus non-significant.


Validity type Question Issue
Statistical conclusion validity Estimates too uncertain? Statistical inference
Internal validity Are causal estimates biased? Causal inference
Construct validity What was measured, really? Language use (labeling of variables)
External validity Relevant outside the study context? Generalization


Example study

We conducted a between-subjects experiment where participants performed a simple task (proof-reading) either in quiet (control group) or while exposed to loud noise (treatment group) from loudspeakers in our sound-proof laboratory. We hypothesized that the treatment group would, on average, perform substantially worse than the control group on our outcome measure: the number of errors made on the simple task. This error count served as our measure of the construct ‘noise-induced distraction’.

Validity:

  1. Question: Are effect-size estimates precise enough to say anything about direction and practical relevance of the results?
  2. Threat: Large compatibility intervals due to small sample sizes. Results inconclusive, as the observed data would be compatible with large as well as negligible or even reversed effects.
  3. Design element: Increased sample size to improve the precision of the estimated group difference (i.e., to obtain narrower compatibility intervals).
  1. Question: Would we be justified in claiming that the observed group difference is a valid estimate of the average causal effect of the treatment on performance in our sample?
  2. Threat. Group-threat: Maybe the groups were unequal to start with on factors related to performance. This systematic error may lead to underestimation or overestimation of the causal effect in the sample.
  3. Design element: Random assignment of participants to treatment groups, to obtain groups balanced on potentially confounding variables (measured and unmeasured).
  1. Question: Would we be justified in claiming that the observed effect is relevant to the construct of interest?
  2. Threat. Maybe performance errors in our laboratory is not a valid measure of our target construct (noise-induced distraction).
  3. Design element: Multiple outcome measures, for example, self-reported distraction and eye-movements (to check how eyes follows the text). If they all point in the same direction, this would make us more justified in generalizing from measurements to construct.
  1. Question: Would we be justified in claiming that the size of the causal effect applies in a realistic environment (and not only to the participants in our experiment)?
  2. Threat. People may behave different in our unrealistic setting (sound laboratory) than in real life, such as in a work place.
  3. Design element: Conduct the experiment in a real workplace setting using concealed loudspeakers, ensuring that the purpose of the study remains masked from the workers, as much as ethical guidelines permit.

Practice

The practice problems are categorized as Easy (E), Medium (M), and Hard (H). Credit goes to Richard McElreath and his excellent book, “Statistical Rethinking” (2020), from which I adapted this layout of practice problems.

Easy

1E1. Read the Introduction section of Michal & Shah (2024) and identify the sentence(s) where they:

  1. Introduce the research area.
  2. Identify the knowledge gap that justifies the research.
  3. Formulate the research question or hypothesis.
  4. Describe and justify their design strategy.
  5. Rephrase (c) into a single question that incorporates the key independent and dependent variables, along with the study units.

Find article here


1E2. Explain the difference between random and systematic error, with reference to:

  1. Scores on an exam in Research Methods.

  2. Difference in average grades between two schools in a specific year.

  3. Average scores of control and treatment group in a randomized experiment.


1E3. Please find alternative explanations:

  1. “Industrial workers are healthier than the general population. Thus, work in industry is good for your health.”

  2. “Children in schools exposed to aircraft noise have higher grades than children in non-exposed schools. Thus, aircraft noise cannot have adverse effects on children’s learning.”

  3. “Productivity increased after we improved the lighting. This proves that good lighting conditions is important for productivity.”

  4. “With increasing traffic volumes, exposure to residential road-traffic noise has increased substantially over the last decades. In the same period, we have seen a remarkable reduction in the number of heart attacks. Thus, road-traffic noise cannot cause heart attacks, as some noise researchers seem to suggest.”


1E4. The design elements random selection of participants from a population and random assignment of participants to treatment conditions serve distinct purposes.

Explain these purposes in the context of Campbell’s validity typology.

This is an old exam question:


Medium

1M1.

  1. Explain with an example how the “placebo effect” may pose a threat to the validity of a research claim.

  2. The placebo effect is often thought of as a threat to internal validity, but may be better viewed as a threat to construct validity. Explain.

Note. And remember: Understanding why a threat to validity, like the placebo effect, might mislead us is crucial; accurately classifying it within Campbell’s typology is less important.


1M2. Campbell’s validity typology can be simplified into two main categories: internal and external validity. In which of these categories would you place


1M3. Please find alternative explanations:

  1. “The top 10 schools in terms of average performance on the national standardized tests were all small schools with fewer than 500 pupils. Reducing school size would increase school performance.”

  2. “A flurry of deaths by natural causes in a village led to speculation about some new and unusual threat. A group of priests attributed the problem to the sacrilege of allowing women to attend funerals, formerly a forbidden practice. The remedy was a decree that barred women from funerals in the area. The decree was quickly enforced, and the rash of unusual deaths subsided. This proves that the priests were correct.

b. taken from the excellent book “How We Know What Isn’t So” Gilovich (2008). :::

Hard

1H1. Refer to Figure 1.1 to answer the following questions:

  1. What function, \(Error = f(N)\), was used to draw the blue line? (Check out the code behind the figure.)
  2. Why do you think this function was used?


1H2. “The reviewer raised concerns about the small sample size, but this should not be an issue, given that the difference I observed was highly statistically significant.”

Explain why the reviewer had a point despite the statistical significance of the findings.

Note. You may consult Gelman et al. (2021), Ch. 16.1: The winner’s curse in low-power studies.


1H3.

“Babies to smoking mothers have an increased risk of mortality within one year, compared to babies to non-smoking mothers. However, among babies born with low birth weight (LBW), the opposite seems to be true, so a smoking mother is protective for LBW babies”.

Please find an alternative explanation.

Note. This one is hard, we will discuss it later on, but if you want to jump ahead, please check out Banack & Kaufman (2014).


(Session Info)

Code
sessionInfo()
R version 4.4.2 (2024-10-31 ucrt)
Platform: x86_64-w64-mingw32/x64
Running under: Windows 11 x64 (build 26100)

Matrix products: default


locale:
[1] LC_COLLATE=Swedish_Sweden.utf8  LC_CTYPE=Swedish_Sweden.utf8   
[3] LC_MONETARY=Swedish_Sweden.utf8 LC_NUMERIC=C                   
[5] LC_TIME=Swedish_Sweden.utf8    

time zone: Europe/Stockholm
tzcode source: internal

attached base packages:
[1] stats     graphics  grDevices utils     datasets  methods   base     

loaded via a namespace (and not attached):
 [1] htmlwidgets_1.6.4 compiler_4.4.2    fastmap_1.2.0     cli_3.6.5        
 [5] tools_4.4.2       htmltools_0.5.8.1 rstudioapi_0.17.1 yaml_2.3.10      
 [9] rmarkdown_2.29    knitr_1.50        jsonlite_2.0.0    xfun_0.52        
[13] digest_0.6.37     rlang_1.1.6       evaluate_1.0.3